Here are a few slides from our 3rd Quarter Real Estate Trends presentation, and suggestions on how real estate brokers might explain them to clients. These slides are particularly useful for first time buyers and investors. They can assist decision-making for trade up buyers, too.
Feel free to use in social media, newsletters, or anything you can dream up. We have an amazing opportunity for buyers in this market and we need to get the word out! It probably won’t last until Feb 2019.
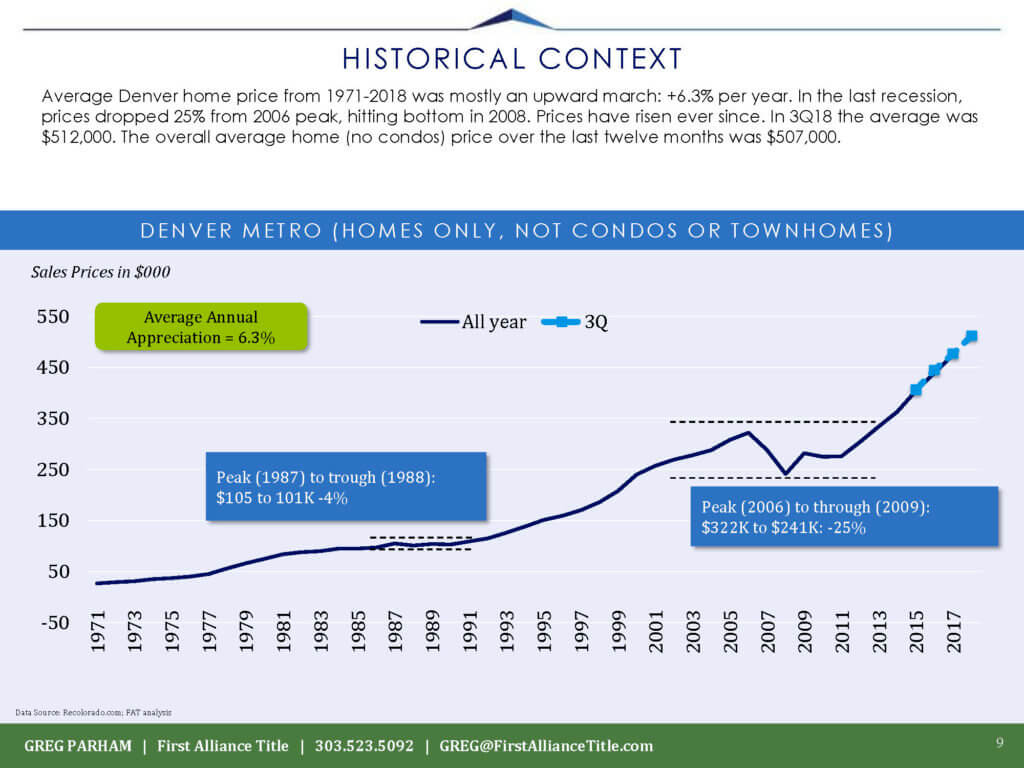
- You can see the price of homes continues to go up (same for condos; we have a different chart for that)
- We expect the recent market softness will continue, until about 1/15/19. Near term results:
- Increase inventory
- Increase DOM (days on market)
- Slightly increase discounts
- Increase the ability for buyers to get concessions
- Increase the flexibility of sellers to accept contingent offers
- We expect that the rate of price increases to slow down from the 8-10% range we have experienced to closer to the historical norm, perhaps 4-6% increases
- We don’t expect prices to drop. That seems to be the consensus of most economists.
- The lead economist at the Mortgage Bankers Association just published a forecast that they expect mortgage rates to increase to 5.1% (from 4.8% currently) by next summer
- Thus, all indicators suggest that this is a better time to buy than next spring
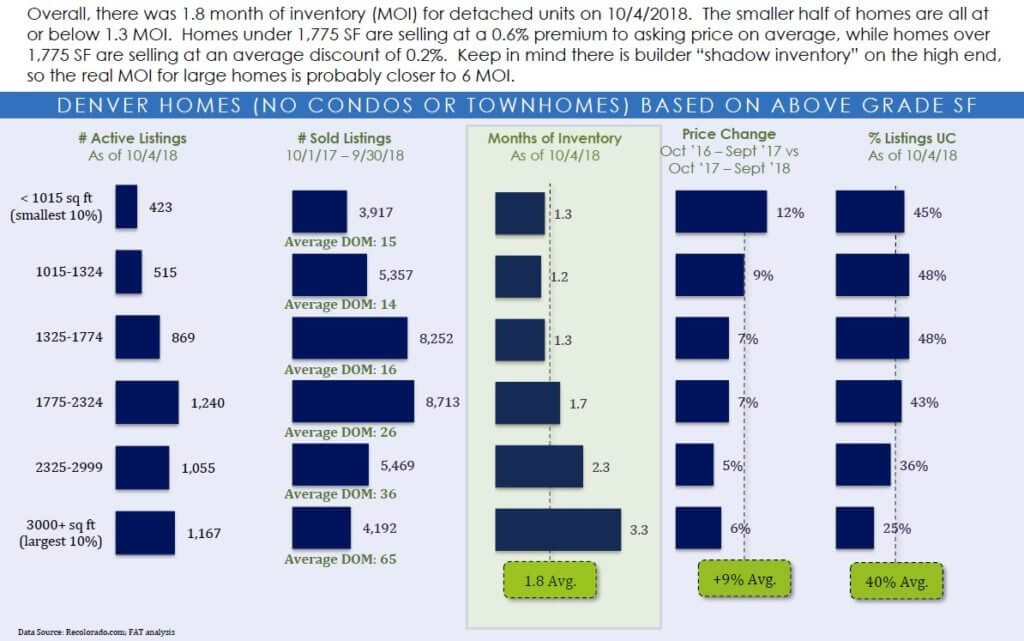
- The highlighted area in green is the MOI (months of inventory) for different sizes of homes
- Smallest 10% (above grade, not counting basements) is the top bar, about 1000 SF or less
- Biggest 10% is the bottom bar, about 3000 SF or more
- You can see that we have 1.3 MOI for the smaller homes – up significantly from the 0.8 MOI we have had !!
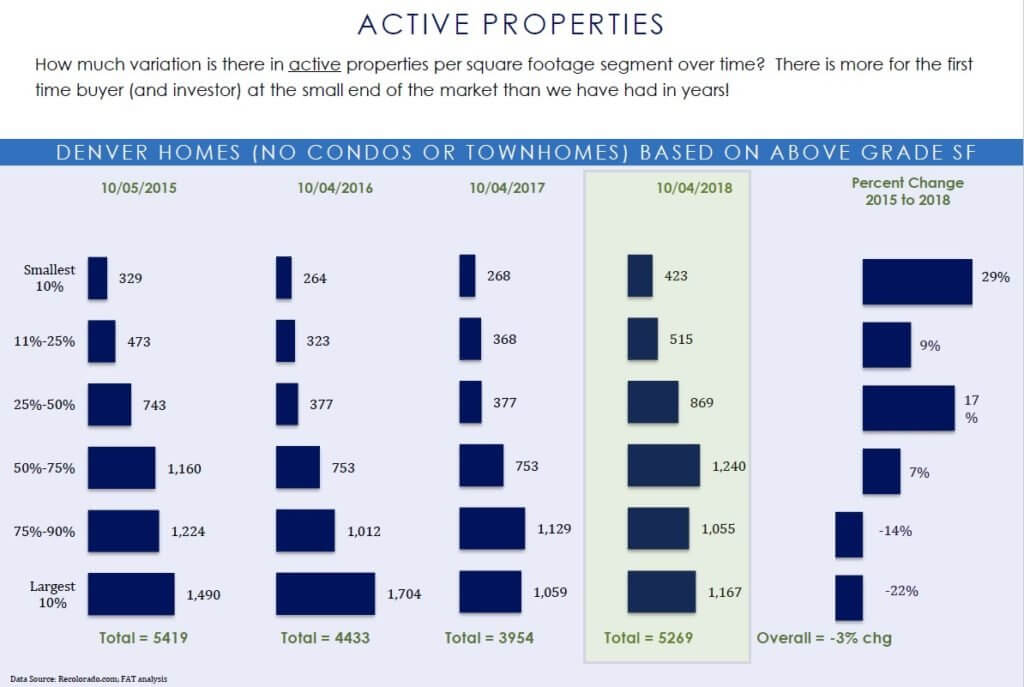
- The green box is the current inventory of homes available one the market
- They are sorted into size buckets, just like the previous slide
- Please look at the top line, the entry level homes under 1,000 SF
- There are more homes to choose from now than there has been at any time in the past four years
- In fact, the inventory for small homes is up 29% vs. 2015, and almost double what it was in 2017.
While there is more inventory now than this time last year…. Overall… it’s about the same inventory count as 2015. The inventory (finally!) is just better distributed across all size segments, giving ALL buyers an equal shot at buying a home. As you can see in 2015 and 2016, most of the available inventory consisted of high end, large homes.
Do you want to learn more? Please join us for one of our one hour presentations where we will discuss this data and much more. Here are our upcoming classes: Upcoming Training