Denver’s real estate market has shown a huge rebound now that in-person showings have resumed. Here’s a breakdown of the largest segment of homes, those between $300,000 and $500,000.
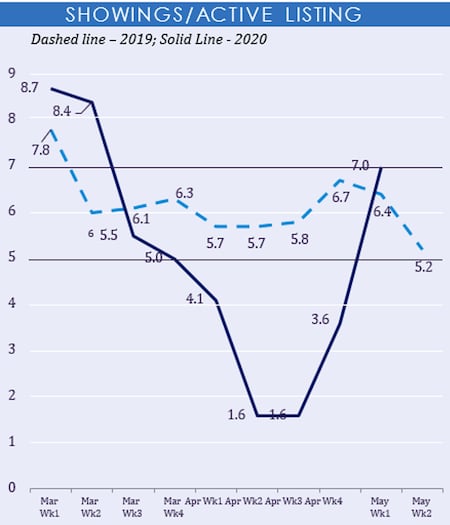
Showings
You can see that before the pandemic we were seeing showings above 2019 levels. You probably felt like this was going to be an extremely busy spring.
Now that the in-person showings have resumed, we’re again seeing showings that are ABOVE last year’s rates. Strong buyer demand!
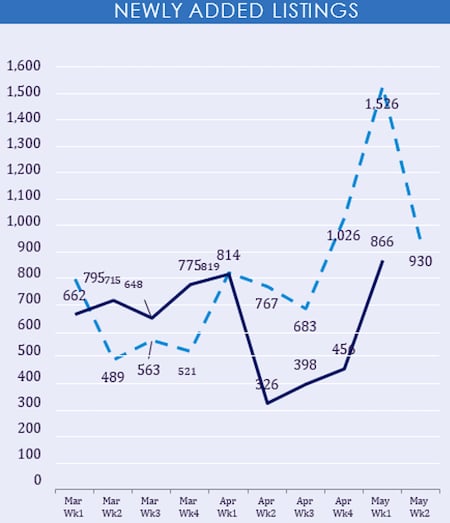
New Listings
New listings have yet to return to last year’s count, but they are up 2.5x from the last few weeks. This upward trend will likely continue to grow to meet or exceed last year’s inventory.
Withdrawn Listings
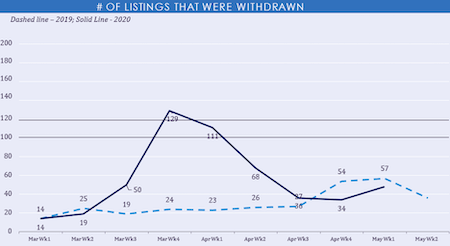
The number of withdrawn listings is actually below the count for last year.