Trying to understand the real estate market’s unit count decline?
Here is a deeper analysis of the numbers extracted from metrolist for the six metro Denver counties (Denver, Adams, Arapahoe, Broomfield, Douglas, Jefferson).
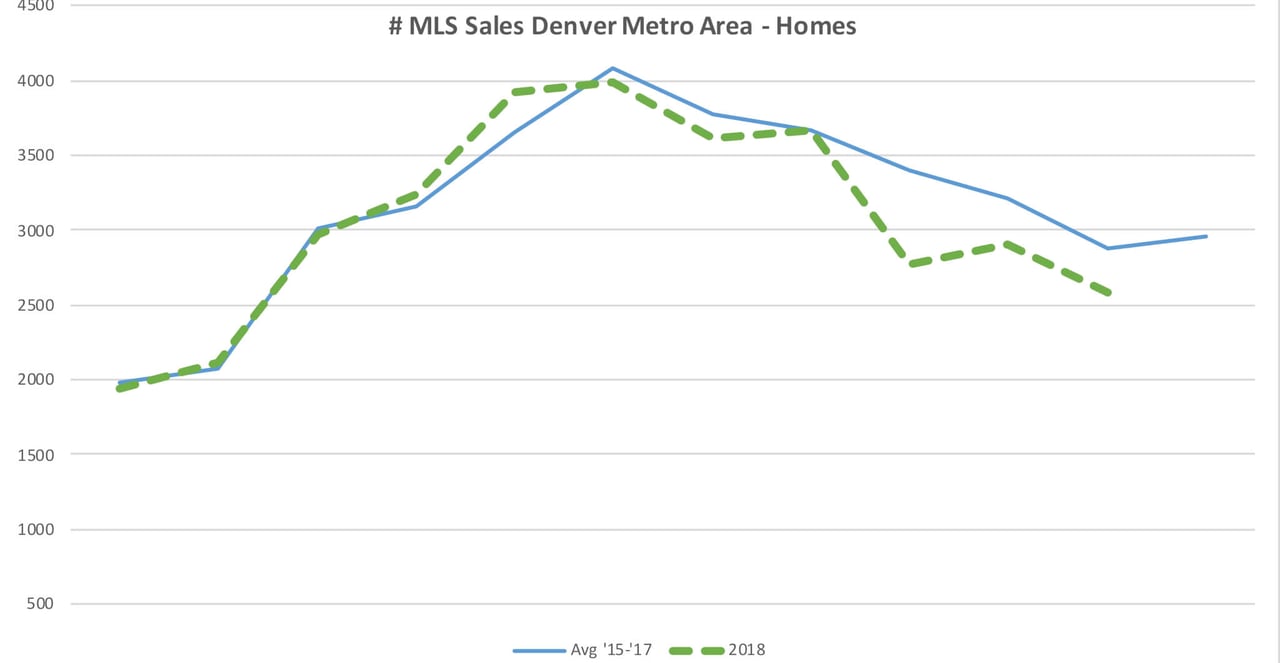
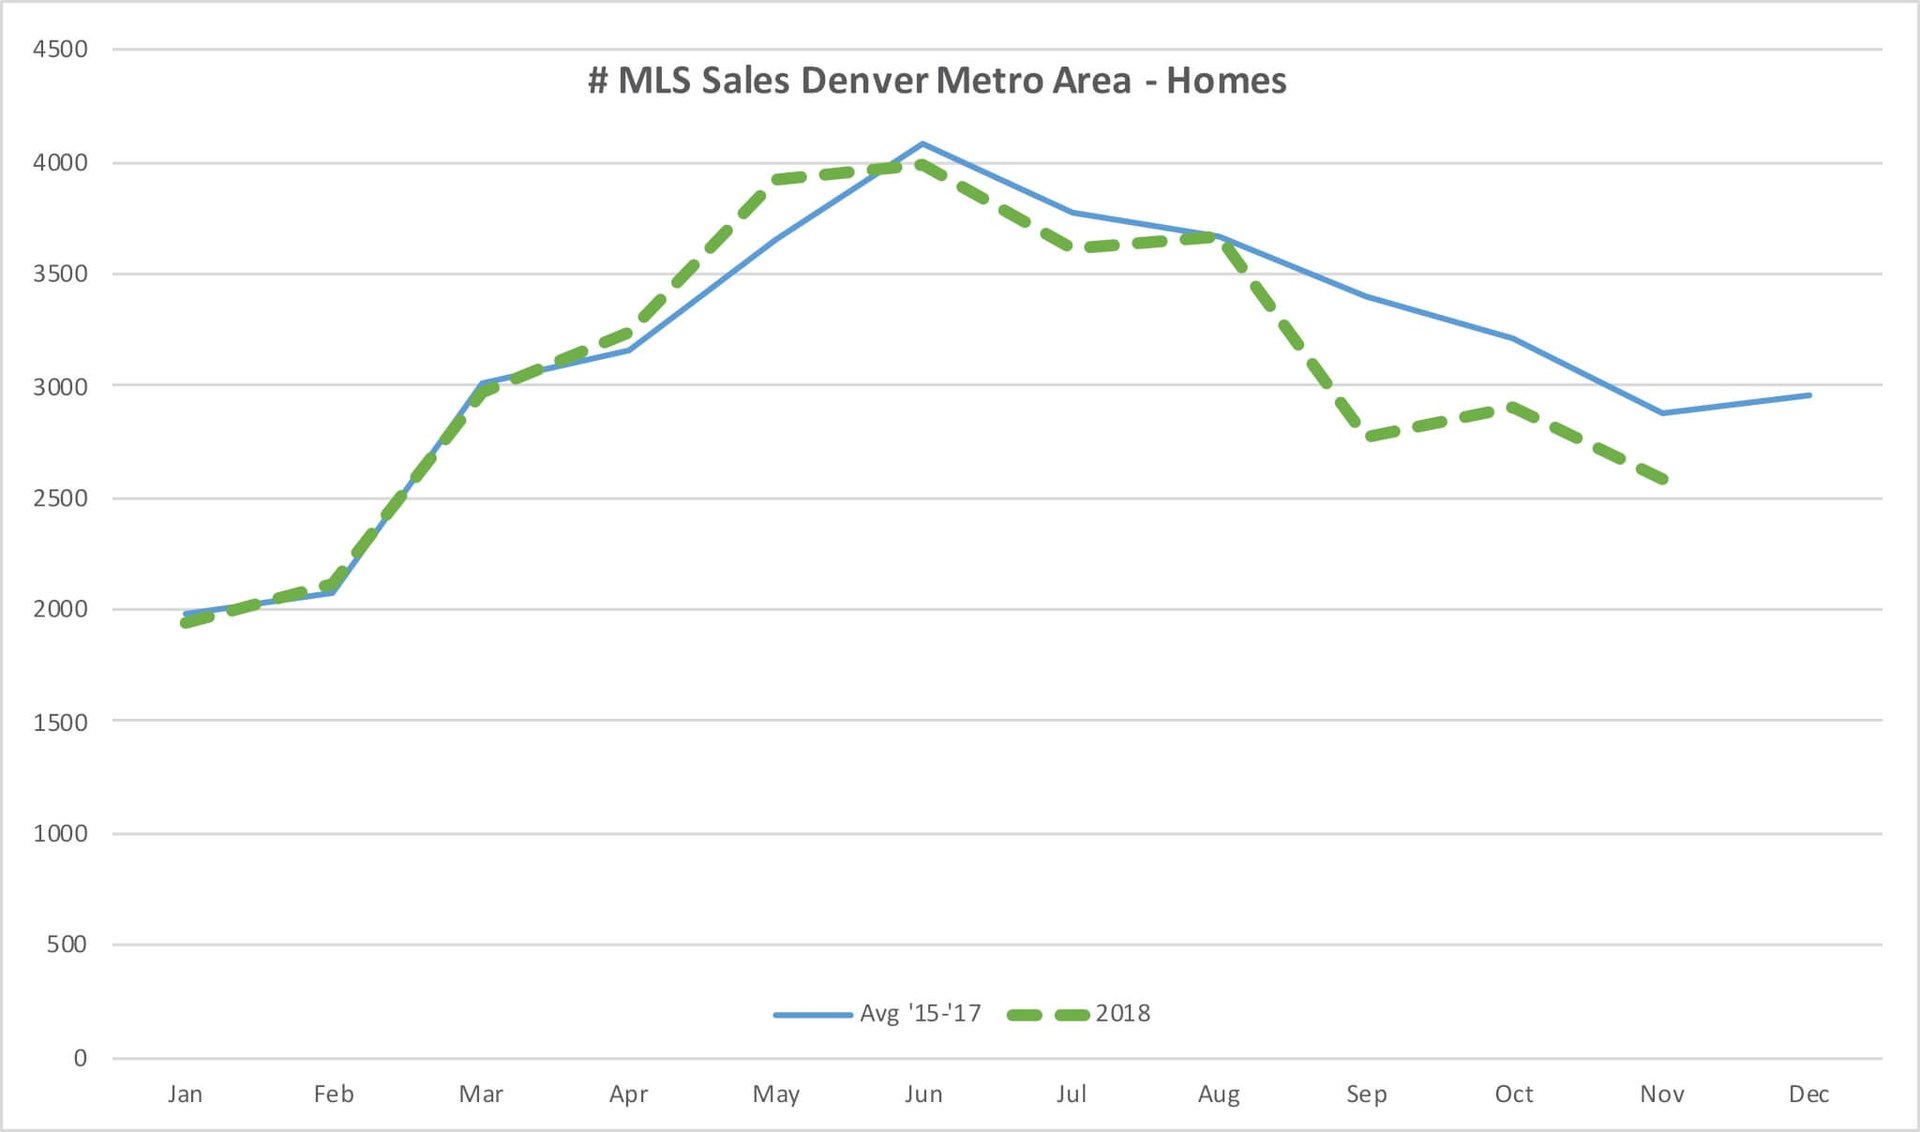
Home Sales
Below, the blue line is the number of closed homes each month. It’s the average of 2015, 2016 and 2017. The highest number of home sales is in the summer, and it’s slowest in January. The green dotted line is this year. You can see our sales volume in Jan – Aug ‘18 was about the same as the prior three years. The last three months have been less than recent historical.
Sept was off -19% in unit count (ouch!) but the recent two months have only been off -10%. With the strong UC we had at month end Nov ’18, and modest gains in showing traffic, we would expect to see Dec ’18 to be around -8% to -12% off this recent historical trend. The decent weather for showings might help too.
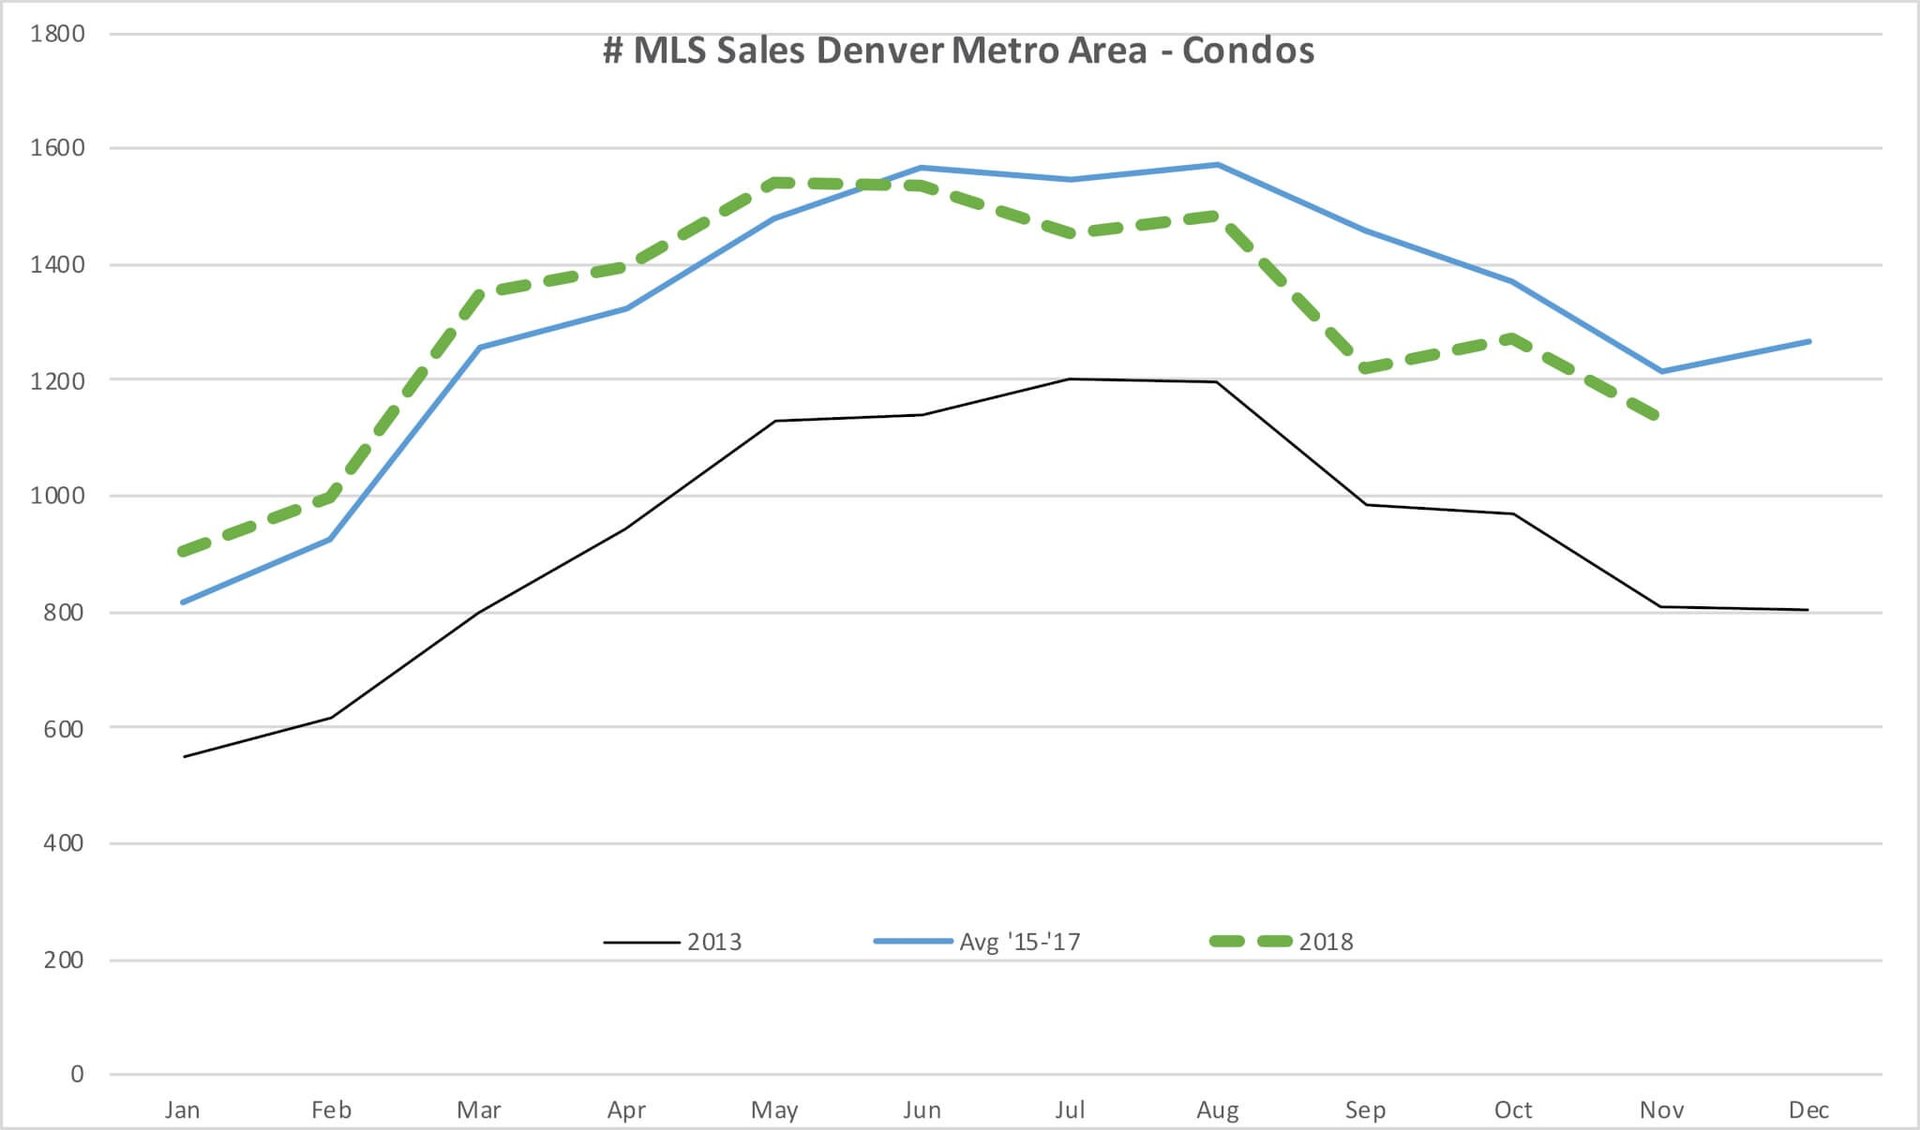
Let’s look at condos.
Our condo market tells pretty much the same story. Sept was off -17% and Oct/Nov were off -7%. Condos, being cheaper, have been a little more resilient than homes. That black line on the bottom is 2013 unit count. As bad as the decline in condo unit sale volume feels, we’re still MUCH better than 2013. Keep in mind the bottom of the cycle was 2009, so the 2013 results are four years past the bottom of the market.
Take Aways
Media is always behind, and they are still processing the start of the decline (Sept) with their negative stories. Your buyers are probably there too, if their dominant source of real estate info is the news. You need to be the information leader!
It’s impossible to predict how the spring will look.
It’s possible we will see 5-10% less volume than prior springs (2015-2018). Of course that will still be a pretty decent market, historically. It’s too soon to say the days of multiple offers and bidding wars are over, but we’ll probably see less of that in spring ’19 compared to the two years prior.