A while back we analyzed deals that went under contract to determine how many go on to close compared to those that cancel. We just updated the analysis (it’s been a while) and got the same results as last time for the average fall-out percentage. This time around we wanted to analyze the impact of various other factors on fall-out rate, like time of year, price level, cash vs loan, etc. As a title company we have great data for this — more than 6,000 transactions over 5 years. Here are the results.
Spoiler alert: The recent change in market conditions have not changed your odds of closing!
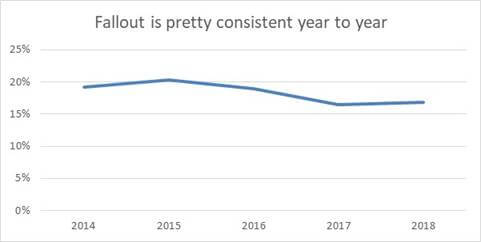
About 80% Of Contracts Go on To Close
About 20% fall out. Fallout has declined a little as the market has slowed down (opposite of popular opinion), but we would not call this a meaningful change.
Fallout is Lowest in March
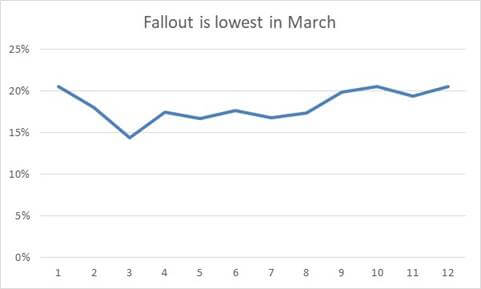
The Month that You Go Uc Doesn’t Matter a Lot Either.
Your odds in March are ever so slightly better than other months, but not really by a lot.
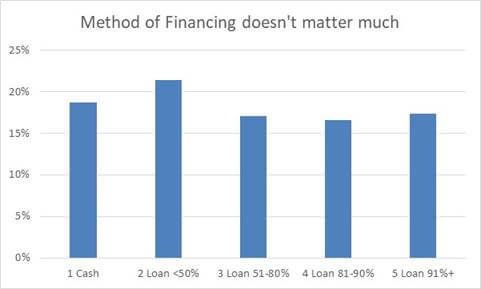
We Wondered (didn’t Think to Check Last Time) if Financing Mattered. It Doesn’t.
We’d wager that most Realtors would guess cash would be more reliable – nope. Higher down payment works slightly worse than lower down payment. FYI,
Good to Know.
Method of Financing Doesn't Matter Much
Large Purchase Are Less Likely to Close
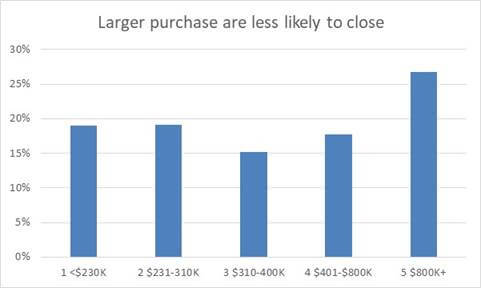
Last but Not Least, Does Size Matter?
Your odds in March are ever so slightly better than other months, but not really by a lot.